Attack Path Analysis
Attack Path Analysis is a UX portfolio case study that showcases my process, deep understanding of security, problem-solving skills, and the impact of my work in the field of cloud and network security. The objective was to design an intuitive interface that addresses the growing challenges around a lack of context that is faced by organizations in safeguarding their digital assets and sensitive data in the cloud.
Background
Traditional security approaches look at resources in isolation. They do not provide users with a real-world picture of their networks and resources and how vulnerable they may really be. Without full context, security personnel may not realize that a relatively unvaluable resource with only low or medium vulnerabilities is all that an attacker needs at that point in the chain to get to their actual target: corporate financial information. An attacker may use this compromised resource as a launching point for a deeper internal attack. The compromised resource provides the attacker access to otherwise inaccessible devices.
The Problem
Individual resource detection of vulnerabilities and misconfigurations will give us the attack vectors for a single resource in isolation, but they will not show or take advantage of the entire attack surface potentially available to an attacker.
How can we see all of this data in context?
When an attacker accesses a resource and becomes a legitimate user on that system, they can then escalate their access on that resource to gain higher privileges. Attacker's actions are seen as legitimate after initial (legitimate) access is attained.. Most detection systems ignore what appears to be legitimate traffic, and any attackers’ actions past the very first user account compromise become invisible.
Without the full context, a user will likely miss that this compromise turns the attacker from an illegal outsider into a legitimate user in the system, able to take advantage of misconfigurations that many detection systems cannot detect. Attack methodologies such as lateral movement allow an attacker to compromise resources throughout the cloud and network virtually invisibly, creating a large footprint within the organization from which to launch deeper attacks against more valuable resources such as corporate financial data.
As Jon Lambert said: “The biggest problem with network defense is that defenders think in lists. Attackers think in graphs.“
So, how do we allow users to see all of this data in context? How can we enable users to view all the data in context and understand that small security issues are critical if they contribute to a larger attack chain? How can we provide real world attack context to a users list of resources and let them see the interconnections between resources in the way that attackers do?
Personas
The personas here became evident quite quickly: Managers of groups of security teams were looking at the resources across the entire cloud, finding the pain points and issues, and divvying the work up among their teams by area of responsibility. The security teams received this data from their managers in the form of work tickets, emails, slack, and other methods. It was most often these managers that determined the priority of paths to fix. In addition the skill set of these managers varied widely, so we had to make this solution intuitive enough for security managers of all levels.
The Solution
So, how do we give users this context? How do we show them that small vulnerabilities or misconfigurations can lead to an increasingly more severe situation, often undetectable? How can we demonstrate to the users that an attack can penetrate through resources to reach a target that was considered inaccessible before??
To begin the project, I conducted extensive research to gain insights into the current landscape of network security and the pain points experienced by security administrators and IT professionals. Through hypothesis, interviews, and competitive and industry analysis, I discovered that organizations struggled with uncovering “invisible” attacks like lateral movement, had great difficulty in managing multiple security layers and determining fix priorities across all of their cloud resources, and a lack of visibility into threats in the right context.
What lay ahead of us was a potentially monumental task, as organizations could have potentially millions of resources to manage. The solution had to be both comprehensive, and yet able to slice and dice and divvy up resources in such a way that the customers could easily manage things at such a large scale.
The solution: Attack Path Analysis, with a visual representation of the paths.
First, we limited the resource types on the target resource. A “target” resource of a NIC (Network Interface Card) doesn’t really make sense. We actually trace the path back from the target to various sources, be they external or interna, in order to validate them. We then apply the same resource type limitations to the source of the attack, while retaining external attack sources.
Simply showing a bunch of connections, or hops, to a target isn’t enough. We have to provide evidence within the UI that this is a legitimate path. This evidence will also lead toward determining which resources along the path need to be fixed first, but more on that later. Evidence comes in a few different forms. The first is we label each hop with its resource name and type (IDs, cloud accounts, etc. are in a hover). Next, we have to show how that node was compromised, so we show the list of potential vulnerabilities and misconfigurations that could be used to compromise that resource in order for it to be part of this attack chain or path. This lets the users know who could be compromised and how, right off the bat.

Initially, we decided to show single paths at a time. It’s better to get that, and all of its interactions, correct before we include multiple paths.
For each resource on the path not only do we show the basic information discussed above on cards underneath each resource, but clicking on the resource will bring up a security-focused side panel that will list not only all the resources’ risk factors in the context of the path itself, but it will also include a few other factors such as how many attack paths this resource is a part of, even outside of the path that we are looking at. The reason for this? If a particular resource in a path is a part of 11 other paths, it’s a good bet that remediating the issues with this 1 resource will at least mitigate all 11 paths. Good information to know at a glance.
Users can now see the full path, and all the factors that will allow an attacker to penetrate deeply into the users’ networks, gain a large foothold, and ultimately compromise a critical target. Critical targets could include corporate financial info, source code, customer info, or encryption keys.

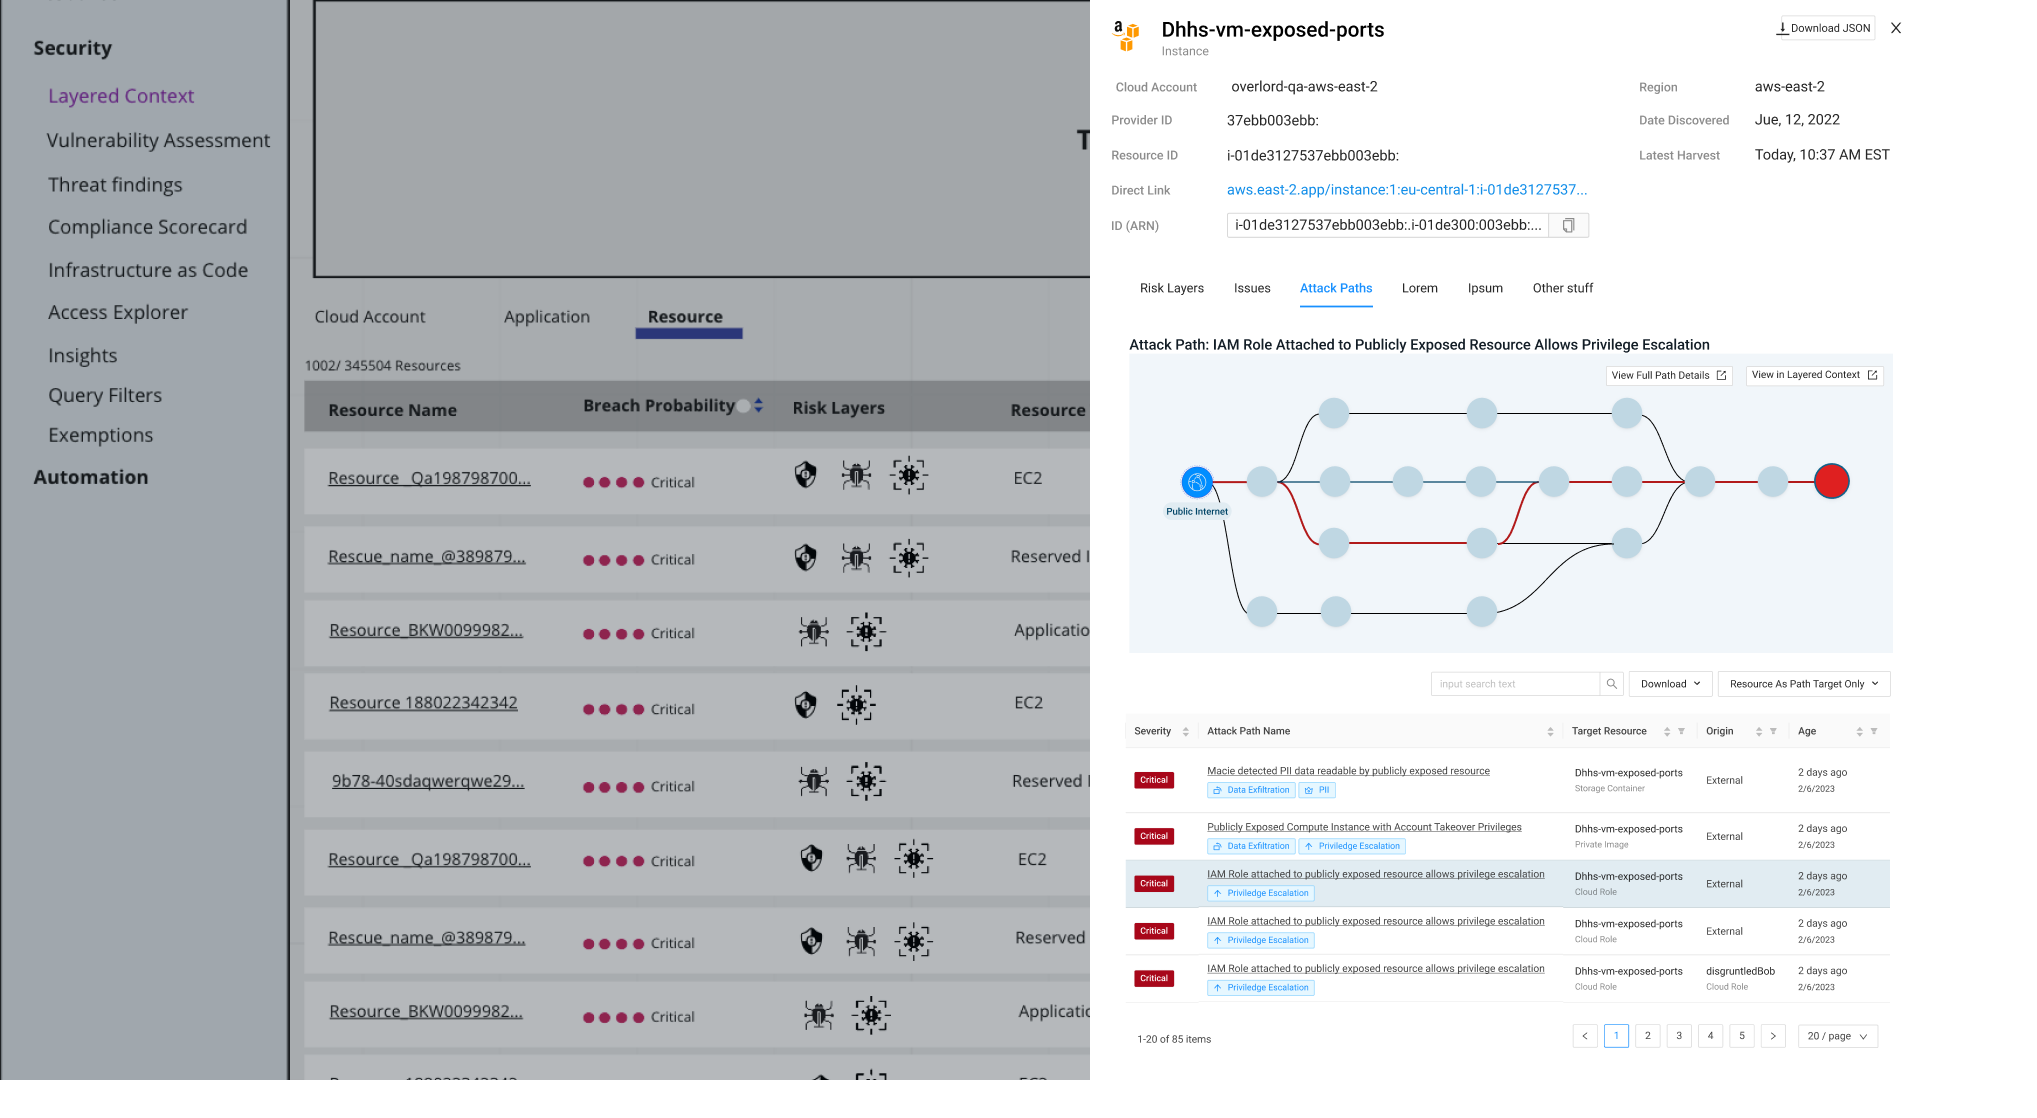
How do we get here? Before we access the screen with the graph, we have a screen that lists out all the attack paths found in the system. The table provides details on the attack path, including labels like PII, Data Exfiltration, and Privilege Escalation. Clicking on a path displays the graph.

There are other ways to get here too. If a user is looking at a resource in another context, such as on the Layered Context screen or in the resource inventory screen, information about attack paths should be readily available as well. The resource side blade/drawer will have an attack paths tab, which includes a condensed visualization with a listing of the paths. From there, the users can easily navigate directly to the graphs for any path with just a single click. A mockup for this is shown below. Clicking on a path would take them to the full visualization.
Designing for the future
The upcoming next generation will including multiple attack paths on a single graph diagram, which will necessitate an evolution of the attack paths list to be a more target-centric table with greater filtering and slicing and dicing capabilities, as well as prioritized risk scores for paths. We will also include internal resources, and I evangelized across teams for the need for prioritized fix information. When path diagrams are complex, it’s not always so easy to determine which resources to remediate in order to best mitigate the attack path with the greatest efficiency. Full Attack Path remediation may not always be possible, especially when dealing with very high volumes of paths, so it’s very important to at least strategically break the path if we can’t remediate every single resource within the paths. But which to fix first? Second? The fix process I suggested will focus on resolving the critical targets, as well as choke points, and break many paths at once.
Click on the images below to see them full-sized, with summary descriptions.